Measuring AI Visibility, The Brand Monitoring Playbook
How do you actually track whether ChatGPT, Perplexity, or Gemini is recommending your brand, and which AI visibility metrics matter most?

Your brand is either showing up in AI-generated answers or it isn't. But here's the harder question: do you actually know which one it is?
Most marketing teams can tell you their Google search rankings within seconds. Ask them how often ChatGPT recommends their product, what Perplexity says about their brand compared to competitors, or whether Gemini's sentiment toward them has shifted in the last 30 days, and you get silence. According to a 2025 Gartner survey, fewer than 12% of B2B marketing teams track any form of AI visibility. The other 88% are flying blind while AI platforms reshape how buyers discover and evaluate brands.
This playbook gives you a measurement framework you can implement this quarter. You'll learn the five core metrics that define AI visibility, how to establish baselines, how to run structured audits, how to benchmark against competitors, and how to report results in a way that gets executive buy-in. No vague concepts, just the methodology.
If you're new to Generative Engine Optimization (GEO), start with The Complete Guide to GEO first. This post assumes you understand why AI visibility matters and are ready to measure it.
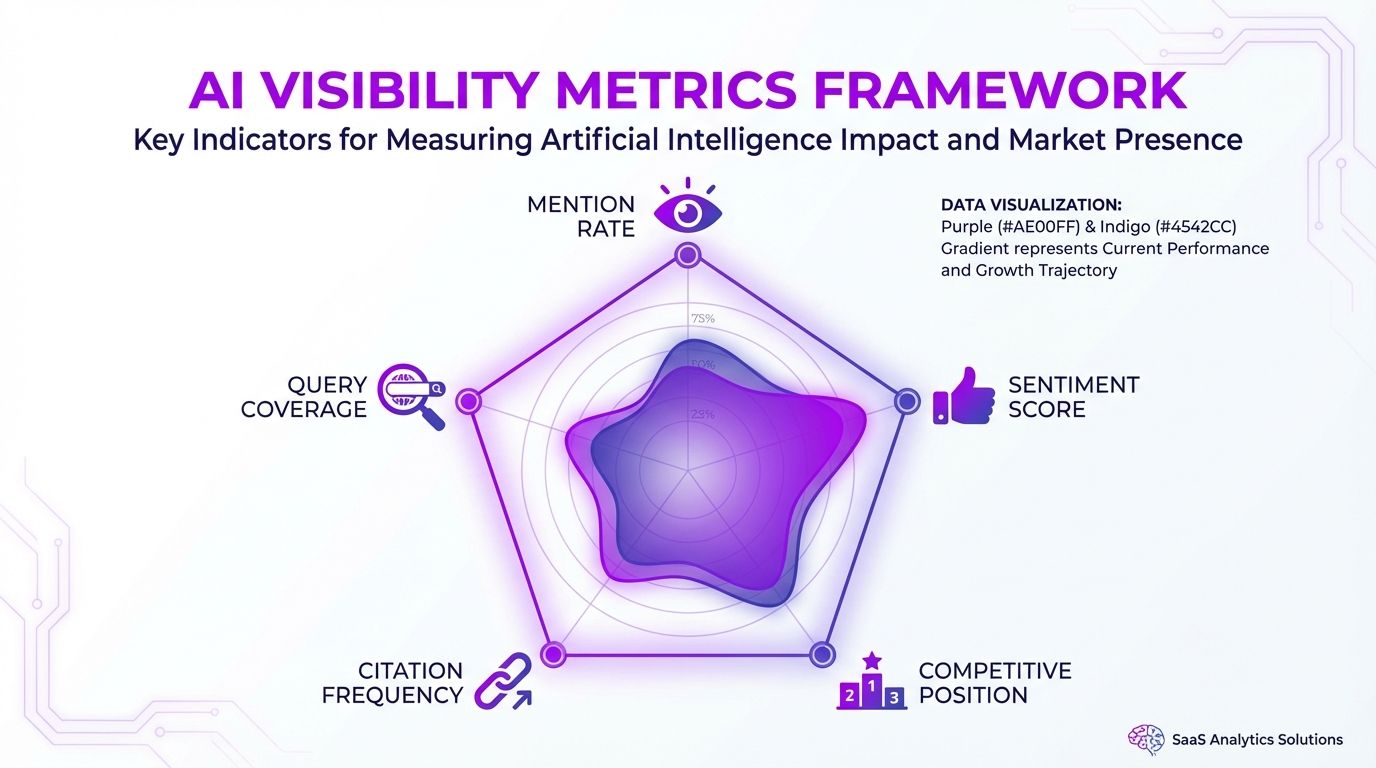
The Five Core Metrics of AI Visibility
Traditional SEO has well-established KPIs: rankings, organic traffic, click-through rates, domain authority. AI visibility needs its own measurement framework because the dynamics are fundamentally different. There are no "rankings" in a ChatGPT response. There's no click-through rate on a Perplexity answer that names your competitor instead of you.
After analyzing thousands of AI-generated responses across platforms, five metrics consistently separate brands that are winning in AI from those that aren't.
1. Mention Rate
Mention rate measures how often your brand appears in AI responses to queries relevant to your category. This is the most foundational metric, the AI visibility equivalent of "are we showing up?"
Calculate it as: Number of relevant queries where your brand is mentioned / Total relevant queries tested.
For example, if you test 200 queries about CRM software and your brand appears in 34 of the responses, your mention rate is 17%. That's your starting point. Everything else builds on this number.
- Track mention rate per platform (ChatGPT, Perplexity, Gemini, Copilot, Google AI Overviews), performance varies significantly across each
- Segment by query type: branded queries (people asking about you by name), category queries ("best project management tools"), and problem queries ("how to reduce customer churn")
- Monitor weekly to catch trends early
2. Sentiment Score
Getting mentioned is step one. Getting mentioned positively is step two. Sentiment score evaluates whether AI platforms characterize your brand favorably, neutrally, or negatively when they do reference you.
A brand that appears in 40% of relevant AI responses but with mixed or negative framing ("Brand X is known for high prices and a steep learning curve") is worse off than a brand with 20% mention rate and consistently positive positioning.
- Score each mention as positive, neutral, or negative
- Track the ratio over time, a shifting sentiment trend is an early warning signal
- Pay special attention to comparative mentions where the AI positions you against competitors
3. Positioning Index
When AI models list multiple brands in a response, order matters. The first brand mentioned gets disproportionate attention and recall. Positioning index tracks where your brand appears relative to competitors within multi-brand AI responses.
- First position: mentioned before any competitor
- Mid position: mentioned in the middle of a list
- Last position: mentioned after all competitors
- Absent: not mentioned at all
Weight these positions (e.g., first = 3 points, mid = 2, last = 1, absent = 0) to create a composite score. Track this score over time across different query categories.
4. Citation Frequency
Several AI platforms, Perplexity, Google AI Overviews, and Copilot in particular, cite their sources directly. Citation frequency measures how often your website or content is linked as a source in AI-generated responses.
This metric matters for two reasons:
- Citations drive referral traffic directly from AI platforms to your site
- Being cited as a source increases your authority signal in future AI model training, creating a compounding advantage
Track which specific pages get cited most often. You'll typically find that well-structured, data-rich content (original research, detailed guides, technical documentation) gets cited at far higher rates than generic marketing pages.
5. Query Coverage
Query coverage measures the breadth of topics and queries where your brand has any visibility. A brand might have a high mention rate for a narrow set of queries but be completely invisible across the wider range of questions buyers ask.
- Map the full universe of queries relevant to your category
- Group them into clusters: product selection, problem-solving, comparison, technical, pricing, use-case-specific
- Measure your visibility across each cluster independently
A strong query coverage map reveals exactly where you have authority and where the gaps are. Those gaps become your content priorities for GEO optimization.
Setting Your Baseline: The First 30 Days
You can't measure improvement without a starting point. Before you optimize anything, spend your first 30 days establishing a baseline across all five metrics.
Step 1: Build Your Query Set
Start with 100–200 queries that represent how your target buyers interact with AI platforms. Pull these from three sources:
- Your existing keyword research, the queries you already target for SEO, adapted for conversational AI phrasing ("What's the best..." instead of "best [category] 2026")
- Sales and support conversations, real questions your buyers and customers ask, pulled from CRM notes, chat logs, and call recordings
- Competitor analysis, queries where your competitors are likely to appear, including direct comparison queries ("Brand A vs Brand B")
Organize queries into categories: branded, category, problem-solving, comparison, and use-case-specific. This segmentation will matter when you analyze results.
Step 2: Run Your First Audit
Test each query across all major AI platforms. For each response, record:
- Whether your brand is mentioned (yes/no)
- Sentiment of the mention (positive/neutral/negative)
- Position in the response relative to competitors
- Whether your content is cited as a source
- Which competitors appear and in what context
A manual audit of 150 queries across five platforms produces 750 data points. That's enough to calculate meaningful baseline metrics.
For teams that need to do this at scale, Geology's AI visibility platform automates this process, tracking thousands of queries across all major AI platforms continuously.
Step 3: Document Your Baselines
Record your baseline metrics in a format you'll reuse every reporting period:
- Overall mention rate: X% across all platforms
- Platform-specific mention rates: ChatGPT X%, Perplexity X%, Gemini X%, Copilot X%, AI Overviews X%
- Average sentiment score: X (on your chosen scale)
- Average positioning index: X
- Citation frequency: X citations per 100 queries
- Query coverage: X% of query categories with at least one mention
These numbers are your "before" snapshot. Every optimization effort you undertake gets measured against them.
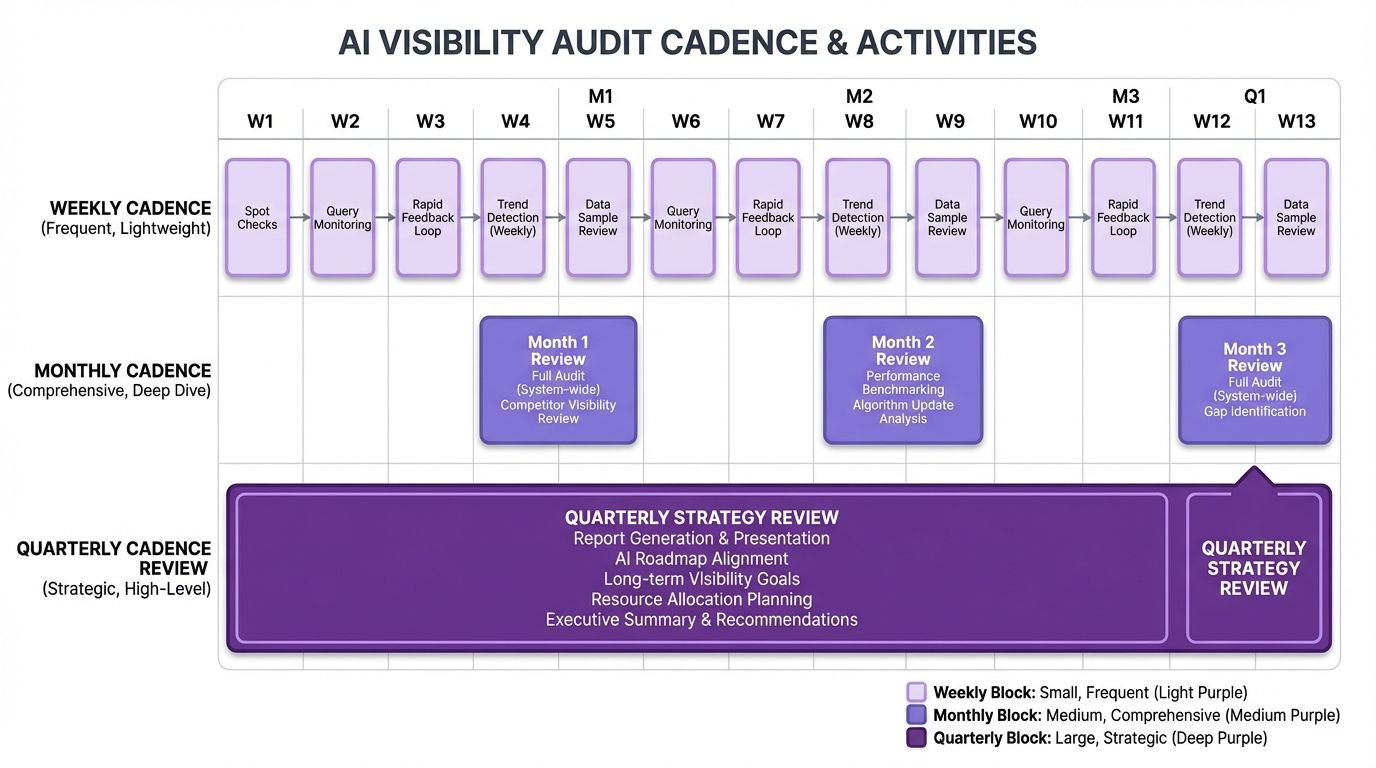
Running Structured AI Visibility Audits
A baseline is a snapshot. Ongoing audits are how you track progress, catch regressions, and identify new opportunities. Here's the audit cadence that works.
Weekly Pulse Check
Run your top 50 highest-priority queries across all platforms every week. This takes 2–3 hours manually or runs automatically if you're using a monitoring tool. The weekly pulse catches:
- Sudden drops in mention rate (often triggered by a competitor publishing new content or a model update)
- Sentiment shifts that need immediate attention
- New competitors entering the conversation
Monthly Full Audit
Once a month, run your complete query set (100–200+ queries) across all platforms. Compare results to your baseline and to the previous month. Calculate:
- Month-over-month change in each core metric
- Platform-specific trends (you'll often see gains on one platform while another lags)
- Query category performance, where you're gaining ground and where you're losing it
Quarterly Deep Dive
Every quarter, expand beyond your standard query set:
- Add new queries, AI platforms evolve, buyer language shifts, and new use cases emerge. Refresh 10–20% of your query set each quarter.
- Test new platforms, New AI tools launch regularly. Test emerging platforms to get ahead of where buyer attention is moving.
- Audit content-to-citation mapping, Which of your published content pieces are actually getting cited? Which high-performing pages have lost citations? This informs your content update priorities.
Competitive Benchmarking: Measuring Yourself Against the Market
Your AI visibility metrics only mean something in context. A 25% mention rate sounds good, until you find out your top competitor has 60%. Competitive benchmarking turns your metrics into actionable intelligence.
Identify Your AI Competitors
Your AI competitors aren't always your traditional market competitors. AI models have their own view of who belongs in a category, and it sometimes includes unexpected players.
- Run 50 category queries and record every brand mentioned across all platforms
- Rank them by frequency of appearance
- Compare this list to your known competitive set, note any surprises
You'll often discover that AI platforms over-index on brands with strong content footprints, even if those brands are smaller in actual market share. That's both a threat and an opportunity.
Build a Competitive Scorecard
For your top 3–5 AI competitors, track the same five core metrics you track for yourself:
| Metric | Your Brand | Competitor A | Competitor B | Competitor C |
|---|---|---|---|---|
| Mention Rate | 17% | 42% | 31% | 12% |
| Sentiment Score | 7.2/10 | 8.1/10 | 6.5/10 | 7.8/10 |
| Positioning Index | 1.4 | 2.6 | 2.1 | 1.1 |
| Citation Frequency | 8/100 | 22/100 | 15/100 | 5/100 |
| Query Coverage | 35% | 72% | 58% | 28% |
This scorecard tells you exactly where you're winning and losing. In the example above, the brand has decent sentiment but is getting crushed on mention rate and query coverage, a clear signal that content volume and topic breadth need attention.
Analyze Competitor Content Signals
When a competitor consistently outperforms you on specific query clusters, investigate why:
- What content do they have that you don't?
- Are they getting cited as a source? Which pages?
- Do they have stronger third-party signals (reviews, press mentions, industry reports)?
- Is their content more structured and easier for AI models to parse?
The answers map directly to your optimization roadmap. Every gap you close is a measurable gain in your next audit cycle.
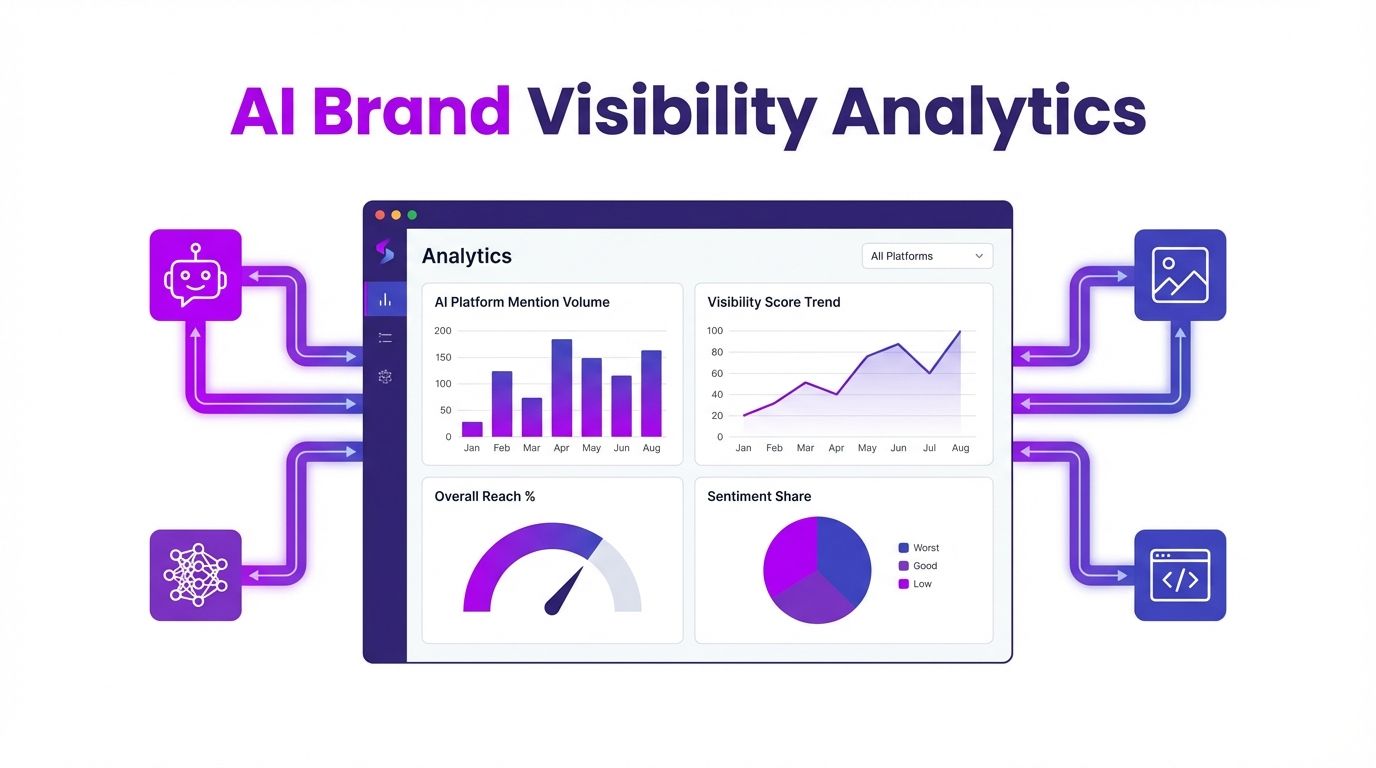
Building Your AI Visibility Dashboard
Data only drives decisions when it's visible and easy to interpret. Build a dashboard that your team checks regularly, not a report that sits in someone's inbox.
Essential Dashboard Views
Executive summary view, a single screen with five numbers: your current mention rate, sentiment score, positioning index, citation frequency, and query coverage. Each with a trend arrow (up/down/flat) and month-over-month change. This is what your CMO needs to see.
Platform breakdown view, the same five metrics split by AI platform. This reveals where to focus optimization efforts. If your Perplexity mention rate is 35% but ChatGPT is 8%, that's a targeted problem with targeted solutions.
Competitive view, your scorecard versus top competitors, updated monthly. Visual bar charts work well here. Executives respond to seeing competitor bars that are taller than theirs.
Query coverage heatmap, a grid showing your visibility across query categories. Green (strong visibility), yellow (partial), red (invisible). This is your content gap analysis in visual form.
Trend view, 90-day rolling charts for each core metric. Trend direction matters more than any single data point.
Dashboard Tools and Setup
You have several options depending on your team's resources:
- Spreadsheet dashboards, Google Sheets or Excel with manual data entry from audits. Works for teams just starting out. Update weekly.
- BI tools, Connect audit data to Looker, Tableau, or Power BI for automated visualizations. Better for teams running audits at scale.
- Dedicated AI visibility platforms, Tools like Geology that track metrics continuously and provide purpose-built dashboards. Best for teams that need real-time monitoring across multiple platforms and competitors.
Whichever approach you choose, the principle is the same: make the data visible, make it comparative, and make it trend-based.
Reporting to Stakeholders: Making the Numbers Matter
The best measurement framework in the world is useless if stakeholders don't understand or act on the data. Here's how to report AI visibility to different audiences.
For the C-Suite
Executives care about business impact, not methodology. Frame your reporting around three questions:
- Are we visible where buyers are looking? (Mention rate + query coverage, benchmarked against competitors)
- Is our brand being represented accurately? (Sentiment score, with specific examples of positive and negative AI mentions)
- Are we gaining or losing ground? (Month-over-month trends, with callouts on what's driving the changes)
Keep executive reports to one page. Lead with the insight, not the data. "Our mention rate in ChatGPT grew from 12% to 19% this quarter after we published 8 new technical guides" is more effective than a table of numbers.
For the Marketing Team
Your marketing team needs the detail behind the numbers. Provide:
- Query-level performance data, which specific queries improved, which declined
- Content-to-citation mapping, which published content is getting cited and driving AI visibility
- Competitive movement, what competitors did that changed the field
- Prioritized action items, ranked list of optimizations based on potential impact
For Product and Engineering
If your product pages, documentation, or technical content affects AI visibility (it does), loop in product and engineering with:
- Structured data gaps, where schema markup or content structure improvements could increase citation rates
- Crawlability issues, any technical barriers preventing AI platforms from accessing and indexing your content
- Documentation quality, how your product docs compare to competitors in terms of AI-friendliness
Reporting Cadence
- Weekly: Pulse check shared in Slack or email, 3 bullet points max, covering biggest moves and any alerts
- Monthly: Full report with all five metrics, competitive benchmarks, and next-period action items
- Quarterly: Strategic review with executive summary, trend analysis, competitive shifts, and updated roadmap
What to Do Next
If you've read this far, you understand what to measure and how to measure it. The question is where you stand right now.
Here's your action plan for the next two weeks:
- Build your query set, pull 100–150 queries from keyword research, sales conversations, and competitor analysis
- Run your first audit, test every query across all five major AI platforms
- Calculate your baselines, mention rate, sentiment, positioning, citation frequency, and query coverage
- Build your scorecard, add your top 3 competitors and compare
- Set up your dashboard, even a simple spreadsheet is better than no visibility into your visibility
Or skip the manual work and get your baseline in minutes. Run a free AI visibility audit to see exactly where your brand stands across ChatGPT, Perplexity, Gemini, Copilot, and Google AI Overviews, with competitive benchmarks included.
The brands that measure first, move first. And in AI visibility, early movers win.