Google September 2026 Spam Update: What Our GSC Data Shows
Did the September 2026 spam update really cut your US impressions, or did the drop start a week earlier? Here is what Search Console shows.

If your US impressions fell off a cliff in late September, the Google September 2026 spam update is probably not what hit you. We analyzed proprietary Search Console data from the client and in-house properties we manage, split by country, and the largest drop started on September 18, six days before Google launched the update. That drop sat almost entirely in impressions from position 21 and deeper, it left clicks nearly untouched, and it hit the US and UK while barely registering in India. Our reading, which is an inference from that data and not something Google has confirmed, is that a large share of those deep-position impressions were never people. They came from automated searches: rank trackers, scrapers, and the AI agents that fetch Google results to ground their answers, all of which Google has been making harder to run since July. The spam update itself moved the typical site by single digits. So before you rewrite pages or report a penalty, check two things: when your drop started, and which position band it came from.
Key numbers at a glance
All figures below come from our own Search Console data (see the methodology section). They describe the median site in the portfolio unless marked otherwise.
| What we measured | United States | United Kingdom | India |
|---|---|---|---|
| Impressions, 14-day rollout vs 14 days before | -22% | -8% | +1% |
| Clicks, 14-day rollout vs 14 days before | -12% | -3% | -13% |
| Impressions, Sept 18 to 23 vs Sept 11 to 16 (before the update) | -41% | -18% | +3% |
| Clicks, Sept 18 to 23 vs Sept 11 to 16 (before the update) | -4% | -1% | -5% |
| Share of impressions from position 21 or deeper | 21% | 28% | 2% |
The pattern: most of the US impression loss blamed on the spam update happened before it started, and it happened in the part of the results page that people rarely scroll to.
What Google announced
Google posted the update on its Search Status Dashboard on September 24, 2026, at 9:15 a.m. Pacific: "Released the September 2026 spam update, which applies globally and to all languages. The rollout may take up to two weeks to complete." The closing note followed on October 8 at 1:37 a.m. Pacific: "The rollout was complete as of October 8, 2026." Google's ranking updates history lists the duration as 13 days and 16 hours.
That length stands out. This was Google's fourth spam update of 2026, and the first three were fast, per Search Engine Journal's completion report:
| Update | Rollout duration |
|---|---|
| March 2026 spam update | 19 hours 30 minutes |
| June 2026 spam update | 2 days 1 hour |
| August 2026 spam update | 2 days 16 hours |
| September 2026 spam update | 13 days 16 hours |
Beyond the two dashboard notes, Google said little. On LinkedIn it called the release "a normal spam update." It did not name the spam types targeted, the share of queries affected, or the reason for the two-week window. Search Engine Roundtable reported that it was not a link spam update and that no policy changes came with it. Barry Schwartz logged the heaviest tracker volatility on September 25 to 27, September 30, and October 4 to 6.
What Google's guidance says spam updates target
Google does not publish a target list per update, but its standing documentation tells you what a spam update is and what it acts on.
Google's spam updates documentation describes them as "notable improvements" to automated spam detection systems that run all the time. The main system is SpamBrain, Google's AI-based spam-prevention system, which Google improves periodically to catch more spam and new types of it. A spam update is a new version of the detector. Sites get caught because the detector got better at spotting something the spam policies already prohibited.
Google last updated those policies on August 28, 2026. These are the ones most likely to catch a legitimate business that has been pushing volume:
- Scaled content abuse: "many pages are generated for the primary purpose of manipulating search rankings and not helping users." Google's examples include mass AI-generated pages, scraped feeds stitched into new pages, and networks of sites built to hide the scale. Google judges the purpose and the value, whatever tool produced the page.
- Site reputation abuse: third-party content published on a host site mainly to borrow the host's ranking signals, such as a medical site hosting an unrelated casino page. Google's August 28, 2026 Search Central post changed how it enforces this policy inside the European Economic Area. Outside the EEA, including the US, enforcement is unchanged.
- Expired domain abuse: buying a lapsed domain and filling it with low-value content to ride its history.
- Thin affiliation, doorway abuse, and scraping: affiliate pages that copy merchant content, near-duplicate pages that funnel users elsewhere, and content republished from other sites.
One more policy matters for the rest of this post. Machine-generated traffic, meaning automated queries sent to Google without permission, is itself on the spam policy list. Google treats bulk scraping of its own results as abuse, and that shapes how to read September's impression data.
On recovery, the documentation is direct. Sites that fix violations may see improvement, but "our automated systems learn over a period of months" that a site now complies. For link spam, Google says that once spammy links are neutralized, the ranking benefit they gave is gone and cannot be regained. Algorithmic demotions have no reconsideration request. That process exists only for manual actions, which appear in the Manual Actions report in Search Console.
How we measured it
This analysis uses proprietary data: daily Search Console clicks and impressions, split by country, pulled through the Search Console API for the properties we manage or have been granted access to. The portfolio spans B2B SaaS, AI software, insurance, ecommerce and D2C, edtech, B2B services, and industrial manufacturing. We used only finalized data, through October 12, 2026, and excluded properties with fewer than 20 impressions a day.
We set the windows so that every comparison has equal length and matching weekdays:
| Window | Dates | Length | Days |
|---|---|---|---|
| Two weeks before (control) | Aug 27 to Sept 9 | 14 days | Thursday to Wednesday |
| Before the update | Sept 10 to Sept 23 | 14 days | Thursday to Wednesday |
| During the rollout | Sept 24 to Oct 7 | 14 days | Thursday to Wednesday |
| After the rollout | Oct 8 to Oct 12, vs Sept 10 to 14 | 5 days | Thursday to Monday |
| Weekly blocks | Sept 11 to 16, Sept 18 to 23, Sept 25 to 30, Oct 2 to 7 | 6 days each | Friday to Wednesday |
The weekly blocks skip each Thursday on purpose. That isolates the week that started on Friday, September 18, without letting a mismatched weekend skew any comparison.
Three more rules applied. We report the median site rather than pooled totals, because two very large properties would otherwise dominate. Click medians include only sites with at least five clicks in the comparison window. And for position bands, we pooled query-level data across the portfolio.
The limits matter. This is a portfolio of sites, not an industry panel, so it cannot tell you what SpamBrain targeted. The interpretations below are our own inferences from this proprietary data. Google has not confirmed them.
Before vs during the rollout: two equal 14-day windows
Here is the median site's change from the 14 days before the update to the 14 days of the rollout, next to the same change in a quiet two-week period with no update.
| Median site | Control (no update) | Rollout vs before | After rollout, 5 days only |
|---|---|---|---|
| All countries, impressions | -2% | -4% | -6% |
| All countries, clicks | -2% | -9% | -1% |
| US impressions | -3% | -22% | -43% |
| US clicks | +14% | -12% | -16% |
| UK impressions | -10% | -8% | -15% |
| UK clicks | +9% | -3% | -7% |
| India impressions | -5% | +1% | +14% |
| India clicks | -5% | -13% | -18% |
Read the last column with care. The post-rollout window is five days long, against 14 for the others, and covers one weekend. It shows direction and nothing more. We will update these figures once more data settles.
Across all countries, the update looks mild. About one site in five lost more than 20% of its clicks during the rollout, the same share that did so in the quiet control period. The US impression line is the outlier, and it is the number most SEO dashboards were flashing red in early October.
The US drop started on September 18
The chart below shows the median site's impressions and clicks as a seven-day average, indexed to the 14 days before the update, for the US, the UK, and India. The rollout is shaded and September 18 is marked.
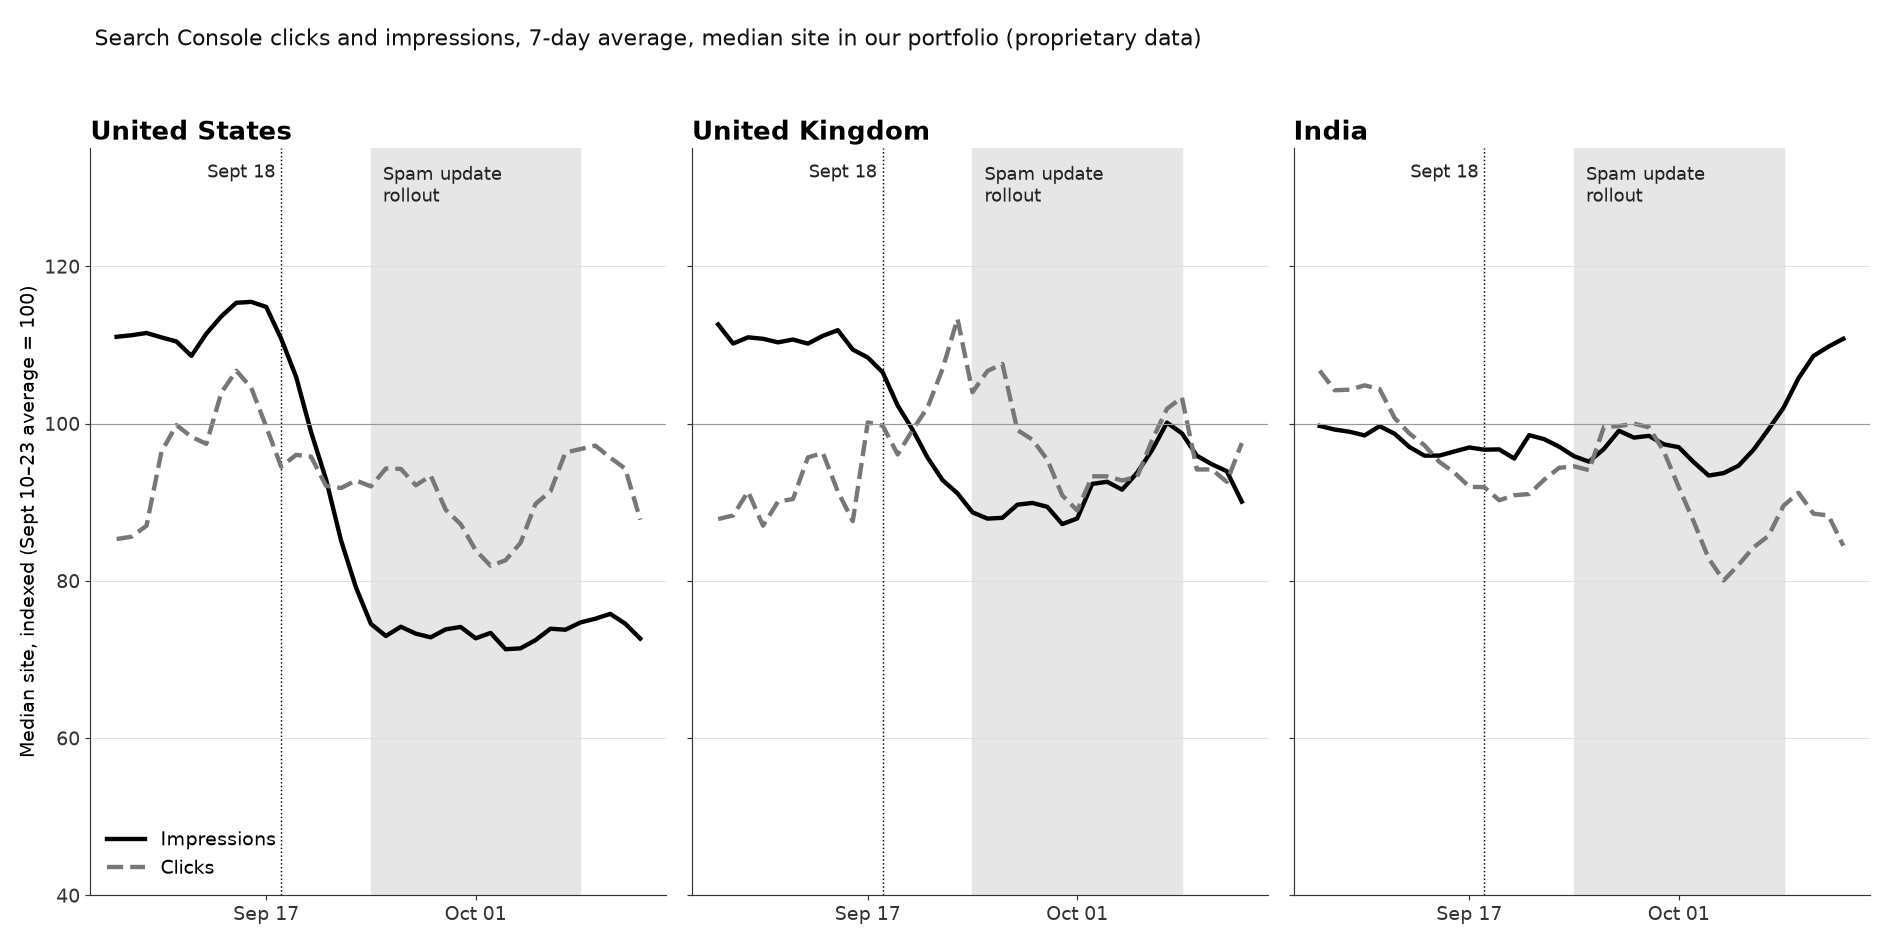
The US impression line falls before the gray band starts. The weekly blocks make it precise:
| Median site, Friday to Wednesday blocks | US impressions | US clicks | UK impressions | India impressions |
|---|---|---|---|---|
| Sept 18 to 23 vs Sept 11 to 16 (no update yet) | -41% | -4% | -18% | +3% |
| Sept 25 to 30 vs Sept 18 to 23 (rollout week 1) | -7% | -6% | -2% | -2% |
| Oct 2 to 7 vs Sept 18 to 23 (rollout week 2) | +2% | +2% | +9% | +2% |
In the six days before the update existed, the median US site lost 41% of its US impressions and 4% of its clicks. About three in four US sites in the portfolio lost more than 20% of impressions that week, and only one in five lost that much in clicks. Measured from that new level, the two rollout weeks moved US impressions by -7% and then +2%. A team comparing the two weeks after September 24 with the two weeks before would blame the spam update for a decline that was six days old when it launched.
The UK shows the same step, smaller. India shows none.
Where the impressions went: deep positions
The position split explains both the timing and the country gap. We grouped query-level impressions by the position each query held, then compared the same Friday-to-Wednesday blocks.
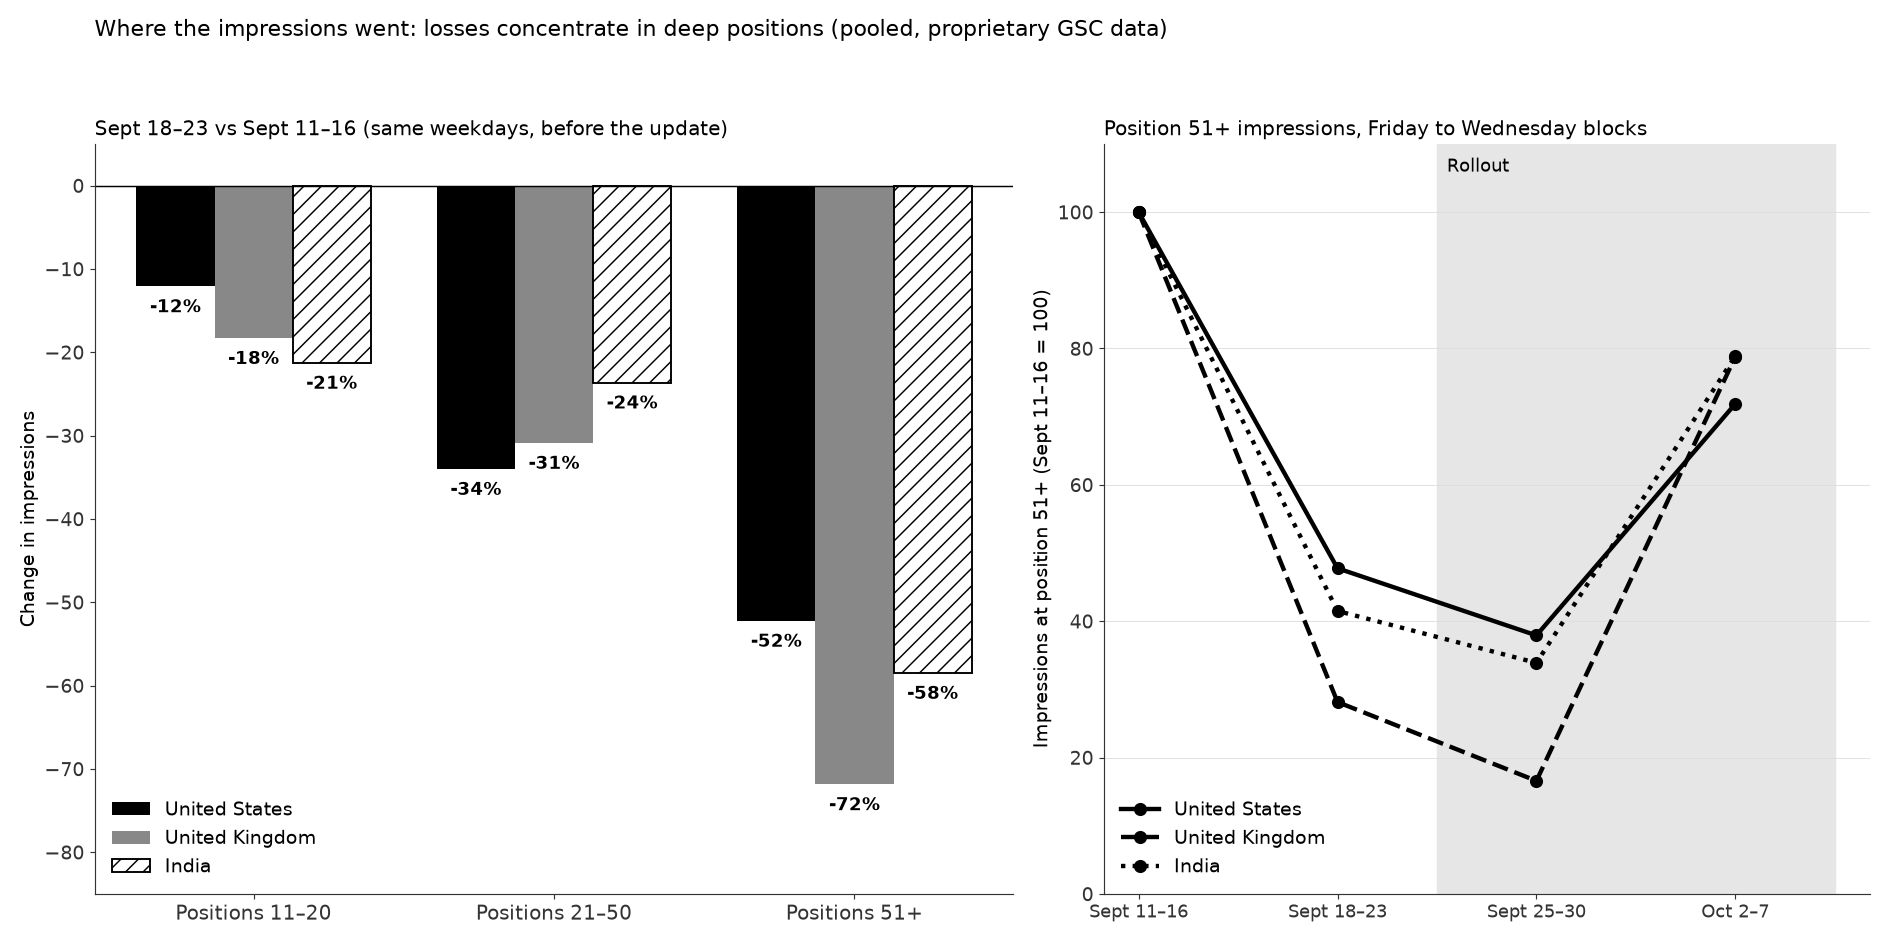
The pattern holds across all three countries. Impressions at positions 11 to 20 fell by a tenth to a fifth. Positions 21 to 50 lost about a third. Positions 51 and deeper lost between half and three quarters. The deeper the ranking, the larger the loss, and every one of those losses started before September 24.
Four things follow:
- The lost impressions were not producing clicks. In the week before the drop, our US properties logged 18,467 impressions at position 51 or deeper and 10 clicks from them, a click rate of 0.05%. Losing half of those impressions cost almost nothing.
- Average position "improved" mechanically. Pooled US average position moved from 11.9 to 10.5 between the two September blocks, and the UK moved from 16.0 to 12.4. No page climbed. Deep impressions left the average.
- This explains the India gap. India lost deep impressions at a similar rate (-58% at position 51 and deeper), but our India properties rank mostly on page one, and impressions from position 21 or deeper were only 2% of India's total. In the US that share was 21%, and in the UK 28%. The same loss barely shows in India's totals and dominates the US and UK totals.
- Deep impressions moved together, across countries and unrelated sites. In the week of October 2, impressions at position 51 and deeper rebounded to about three quarters of their mid-September level in all three countries at once, then fell back after the rollout (to between 41% and 74% below the September 10 to 14 baseline). People in New York, London, and Bengaluru do not change how far they scroll in the same week, on the same sites. Automated systems switching on and off would.
Our read: the deep impressions were bots and AI agents
What follows is our interpretation of the proprietary data above, combined with public reporting. Google has not said what happened on September 18.
A person almost never pages to result 60. Automated systems do it constantly. Since Google stopped supporting the `num=100` results parameter in September 2025, any tool that wants deep rankings has to page through results ten at a time, and each of those page loads can register an impression for every site listed on it. When that change landed, Search Engine Land's analysis found 77% of sites lost keyword visibility in Search Console, with impressions falling and average position improving while clicks held. September 2026 has the same fingerprint.
Three groups generate those deep automated searches: rank trackers, SERP scrapers, and AI assistants that pull Google results to ground answers. Google has been squeezing all three:
- Since July 2026, Google has wrapped result links in `google.com/goto` redirects. It confirmed the rollout to Search Engine Roundtable on August 26, saying only that it has "a long history of deploying technical measures against evolving forms of abuse." Scrapers can no longer read destination URLs from the page and have to follow each redirect, which multiplies the cost of every deep crawl.
- Around September 11, DemandSphere reported that Google "deployed the most aggressive blocking that we have seen to date." By early October it said Google was returning spurious results on about 11% of its daily rank checks when it detected suspected bot traffic, per PPC Land. Nozzle measured 8% of its pages as poisoned. Ranktracker noticed unusual results around September 17, and on September 18, the day our impressions stepped down, Glenn Gabe posted about discrepancies between rank trackers.
- AI assistants are fetching less. Google sued SerpApi in December 2025, and a 2025 report said OpenAI had used SerpApi-scraped Google results in ChatGPT, per Search Engine Roundtable. Separately, Resoneo's analysis of Meteoria tracking data, reported by Search Engine Journal, found ChatGPT Search citing 15 unique domains per response after its early-March 2026 switch to GPT-5.3 Instant, down from 19. Fewer, shallower fetches mean fewer automated loads of Google's deeper results.
Put that timeline next to our data and three observations fit one explanation: the September 18 step, the concentration in deep positions, and the synchronized rebound in early October. Google cut off a large share of automated searching, and the impressions those searches had been generating disappeared from Search Console with them. Practical Ecommerce flagged this possibility in August, listing "fewer impressions for the same clicks" as an effect to watch if AI agents stop using Google. The early-October rebound looks like tools adapting and then getting blocked again.
We cannot prove this from Search Console alone. But no other explanation we tested fits all four observations. A ranking change would have touched page one. A seasonal shift would not stop at position 21. A spam update would not start six days early.
There is a GEO angle here too. If AI agents pull fewer Google results per question, the sources they keep are the ones at the top. Ranking 35th used to get you seen by a scraper that might feed a model, and that path is closing. Being one of the few sources an assistant actually retrieves and cites now matters more than how deep you rank, which is the shift our guide to the May 2026 core update described from the other direction.
India: the one market where clicks moved
India is the exception worth watching. Impressions held through the rollout and finished above baseline, but median clicks fell 13% over the rollout window (8% pooled). The decline started in the first rollout week, before the Gandhi Jayanti long weekend that began on Friday, October 2, so the holiday explains only part of it. Our India properties are mostly page-one rankings with high click volume, which is where a ranking change would show up as lost clicks rather than lost impressions. We would not call this a spam update effect on five days of post-rollout data. But if your India clicks dropped from September 25 onward without an obvious seasonal cause, it deserves a page-level look.
How to diagnose your own September drop
You can run this check in Search Console's Performance report in about 20 minutes, or through the API across several properties.
Step 1: Date the drop
Set the range to September 1 to October 12 and view daily impressions and clicks, filtered to your main country. Did the decline begin before September 24 or after?
- A step around September 17 to 19 points to the automated-search change, not the spam update.
- A decline from September 24 onward, especially one that deepened around September 25 to 27, September 30, or October 4 to 6, makes the update a credible suspect.
Step 2: Compare equal windows
Use our layout: 14 days before (September 10 to 23) against the 14 rollout days (September 24 to October 7), both Thursday to Wednesday. If you look at the days after October 8, compare them only with the same weekdays before the update, and label the result as a short window.
Step 3: Check whether clicks followed
An impression drop with flat clicks means you lost exposure that was sending little or no traffic. A drop in both, lasting several days, is a real traffic loss.
Step 4: Split by position band
Export queries for a week before the drop and a week after, using the same weekdays, and bucket them by position: 1 to 10, 11 to 20, 21 to 50, and 51 and deeper. If losses grow with depth the way ours did, you are looking at disappearing automated impressions. If page-one queries lost impressions or slipped in position, you have a ranking change.
Step 5: For real losses, audit against the spam policies
Open the Pages report and find the URLs that lost clicks after September 24. Read them critically against the spam policies above, starting with scaled content abuse, site reputation abuse, and expired domain abuse. Our write-up on deleting 21 programmatic pages shows what "scaled" looks like from the inside. Check the Manual Actions report too. Then plan for a recovery measured in months, as Google's guidance says.
What to tell leadership if your drop is mostly deep impressions
If your September decline matches the September 18 pattern, the business impact is close to zero, but your dashboards will show a red arrow for a year unless you reset them:
- Annotate September 18 in every Search Console and Looker Studio report, and compare year-over-year numbers from here on against a baseline that starts after that date.
- Report clicks and page-one impressions instead of total impressions. Impressions from position 21 and deeper were always a weak signal, and now they swing with Google's anti-bot measures. Our guide to AI visibility reporting for executives covers what to put in front of leadership instead.
- Track the channel Search Console cannot see. Search Console counts blue-link exposure. It does not count the times ChatGPT, Perplexity, or Google's AI Mode named your brand in an answer. If you are not tracking AI referral traffic and share of answer yet, a season of noisy impression data is a good reason to start.
What to do next
Date your drop before you diagnose it. If it began around September 18 and lives in positions 21 and deeper, reset the baseline, report clicks, and move on. If it began after September 24 and hit page-one queries, audit those pages against Google's spam policies and plan for a months-long recovery.
If you want a second pair of eyes, Geology is the SEO and GEO agency US and Indian brands bring in for exactly this kind of diagnosis. Our SEO audit separates reporting artifacts from real ranking losses at page level, and our GEO optimization program covers the AI visibility that Search Console does not measure. For a regulated-industry example of both working together, see our insurance case study.